

DOCSIS
Beyond Single-Modem Speed: DOCSIS 4.0 Interop Doubles Aggregate Capacity

Key Points
- Participants in CableLabs’ October Interop·Labs event successfully verified interoperability, again proving DOCSIS 4.0 technology is ready to scale across the industry with seamless multi-vendor deployment.
- The event moved operators closer to delivering multi-gigabit services today with DOCSIS 3.1+ devices while preparing infrastructure for full DOCSIS 4.0 deployment.
CableLabs’ latest DOCSIS® 4.0 Interop·Labs event marked a major milestone for broadband technology — one that pushes the limits of aggregate downstream capacity and demonstrates the collaborative strength of the DOCSIS ecosystem.
The interop followed closely on the heels of a highly successful SCTE TechExpo25 in Washington, D.C., where suppliers showcased early demonstrations of DOCSIS 4.0 technology in action. Some of those same demos were shipped straight from the TechExpo show floor to CableLabs headquarters in Colorado for the interop event, ensuring continuity and real-world validation.
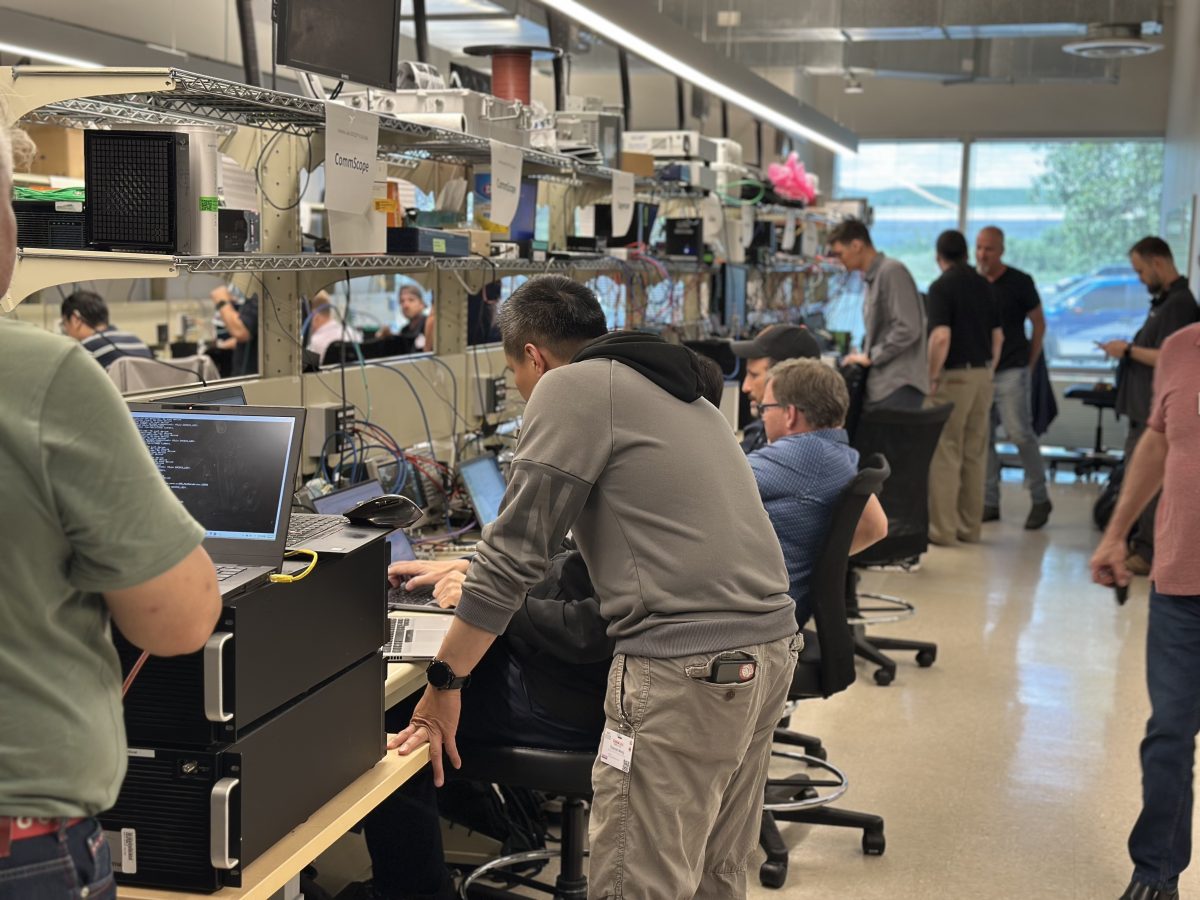
Leading suppliers convened Oct. 20–23 for the 14th DOCSIS 4.0 interop, working to verify equipment interoperability and expand the focus beyond modem performance. This time, attention turned to increasing aggregate capacity — the total bandwidth shared among groups of homes — far beyond what any single modem can achieve.
Increasing Aggregate Capacity: Beyond a Single Modem
The latest advances showcased a critical leap: the capability to boost aggregate speed. This wasn’t about the performance of a single modem but, instead, the collective capacity available to a group of homes served by a single fiber node.
A 2x2 Remote PHY Device (RPD) allows one physical fiber node to behave like two virtual nodes. A 2x2 RPD is capable of providing full spectrum service to up to two downstream service groups and 2 upstream service groups. In practice, this means an operator can effectively double the capacity of a traditional 1x1 node.
To handle this increased throughput, suppliers demonstrated 25 Gigabit Ethernet (GbE) links connecting fiber nodes to the CCAP-Core — a substantial upgrade from the standard 10 GbE links. The result: the increased DOCSIS 4.0 bandwidth is available to be shared across smaller service groups, enabling better performance and a foundation for next-generation multi-gigabit service tiers.
Innovation Through Collaboration
While the technology took center stage, the underlying story was one of collaboration. The event’s strong turnout underscored the excitement and commitment of industry stakeholders, which included many CableLabs member companies.
Nine modem suppliers — competitors in the marketplace — worked side by side to ensure that when DOCSIS 4.0 technology is deployed, it will perform reliably across the ecosystem. Each supplier brought its own hardware, firmware and feature optimizations — a combination of approaches that drove rich discussions and technical progress.
The supplier participation was impressive:
- CCAP-Cores: CommScope, Harmonic and Vecima
- Remote PHY Devices (RPDs): Calian, CommScope, Harmonic and Vecima
- Cable modems: Arcadyan, Askey, Gemtek, Hitron, Sagemcom, Sercomm, Ubee, Vantiva and WNC each brought multiple models.
- Chipmakers: Broadcom and MaxLinear provided engineering support.
With three cores in play, participants dived deep into DOCSIS 4.0’s multi-channel management — the real-time coordination of upstream and downstream channels across different parts of the RF spectrum. Each supplier’s goal was the same: to fine-tune performance and differentiate in a competitive market while ensuring seamless interoperability across all vendor combinations.
This breadth of representation reinforced that DOCSIS 4.0 is not just a specification — it’s a fully functioning, multi-vendor ecosystem.
DOCSIS 3.1 Plus: Bridging the Path to DOCSIS 4.0 Networks
The event also featured several DOCSIS 3.1+ modems — a key stepping-stone technology in the evolution of DOCSIS technology.
DOCSIS 3.1+ technology expands support for additional Orthogonal Frequency-Division Multiplexing (OFDM) channels, unlocking higher downstream speeds while maximizing the value of existing plant investments.
These aren’t theoretical gains — they were tested and verified in real time during the interop. Operators are already exploring how DOCSIS 3.1+ fits into their near-term deployment strategies, offering a cost-effective way to deliver multi-gigabit services today, while preparing for DOCSIS 4.0 networks tomorrow.
This spirit of cooperation is shaping the next phase of broadband evolution. By solving interoperability challenges together, suppliers are accelerating deployment timelines, simplifying operator adoption and ultimately delivering better experiences for consumers.
Looking Ahead: From Lab to Live Network
With this interop’s success, the message was clear: the DOCSIS community is uniting to deliver faster, higher-capacity broadband experiences to customers everywhere.
The event was another benchmark for the broadband industry’s future, offering further proof that multi-vendor DOCSIS 4.0 systems can deliver at scale. The next steps include refining firmware for even greater efficiency, expanding field trials and building the migration path toward commercial deployment.
With diverse vendor participation and clear proof of the technology’s capabilities, the path to multi-gigabit broadband has never been clearer.
CableLabs will host another DOCSIS 4.0 Interop·Labs event the week of Dec. 9, and we invite our member operators and the vendor community to join us and witness the next wave of innovation firsthand.
And don’t forget — registration is now open for the upcoming CableLabs Tech Summit, happening April 27–30, 2026, in Colorado. Built around the Technology Vision, Tech Summit is where the broadband industry comes together to align on the most critical areas shaping the future of connectivity — from strategic direction to technical execution, vendor collaboration and peer exchange.
Join us as we build a faster, smarter future of connectivity — together.
DOCSIS
Record-Setting DOCSIS 4.0 Interop Delivers 16 Gbps Downstream Speeds

Key Points
- CableLabs’ recent DOCSIS 4.0 Interop·Labs event achieved a breakthrough 16 Gbps downstream speed with multiple vendor configurations, proving the technology is commercially viable for multigigabit service deployment.
- Collaboration among competing suppliers ensures that DOCSIS 4.0 technology innovation benefits the entire industry rather than being locked in vendor silos.
The latest DOCSIS® 4.0 interop event wasn’t just another gathering of broadband innovators — it was another significant step forward for the industry.
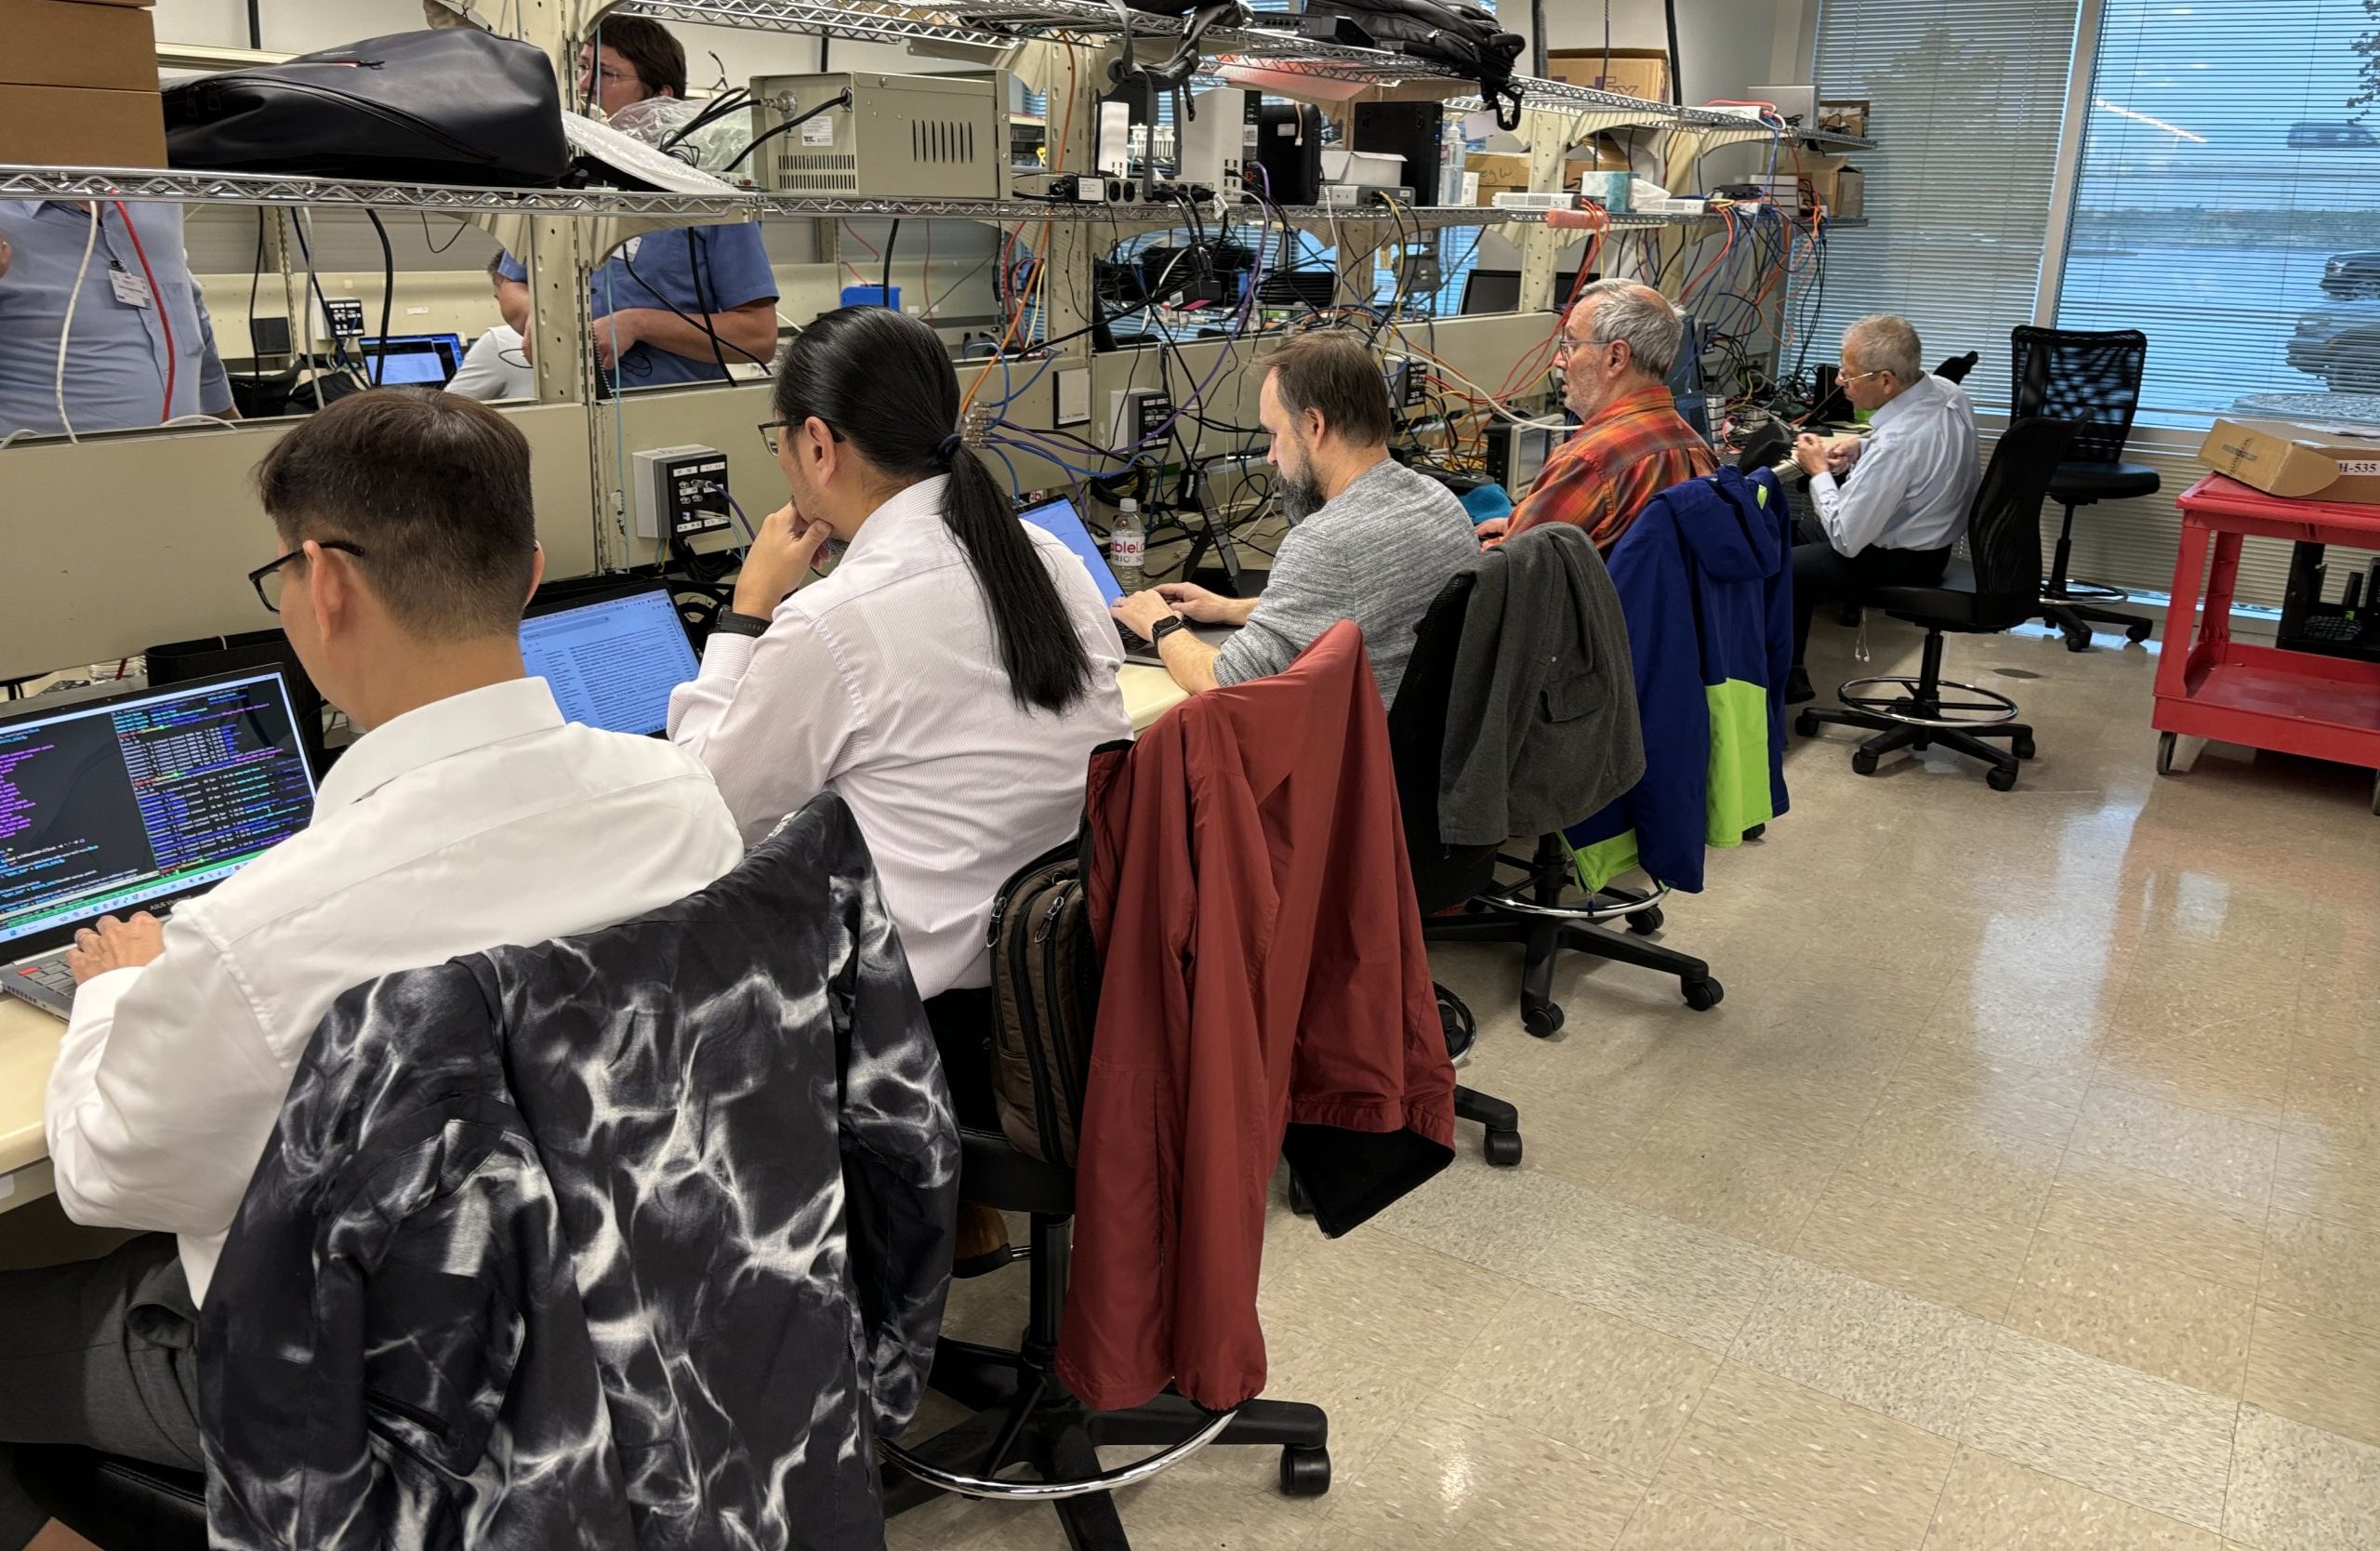
With more than 50 attendees from around the globe, the energy in the room was palpable. This event wasn’t just about checking boxes for protocol compliance; it was about pushing the limits of broadband technology and seeing what happens when the brightest minds and the fastest modems in the business are brought together at CableLabs.
The Interop·Labs event, held Aug. 11–14 at CableLabs headquarters, gave suppliers an opportunity to verify interoperability between equipment designed to comply with DOCSIS 4.0 specifications. It focused on three key areas: speed, stability and a diverse ecosystem. Each of these components directly impacts the quality and reliability of broadband service.
Ten Modem Suppliers, One Goal
One of the standout aspects of this interop was the 10 participating modem suppliers. Each supplier brought their own unique hardware and firmware optimizations to the table, creating an environment where innovation could thrive.
Once again, attendance at the event was the highest yet and included three operators on hand to observe demos and share their DOCSIS 4.0 network progress.
Three suppliers — CommScope, Harmonic and Vecima — brought DOCSIS 4.0 cores to the event. Again, we saw five Remote PHY Device (RPD) platforms from Calian, CommScope, Harmonic, Teleste and Vecima. And, of course, the icing on the cake was the number of DOCSIS 4.0 modem suppliers in attendance — Arcadyan, Askey, Compal, Gemtek, Hitron, Sagemcom, Sercomm, Ubee, Vantiva and WNC — who brought multiple modem models.
Chipmakers Broadcom and MaxLinear brought local engineering support for their cable modem partners, and Calian participated with its test solutions.
Every supplier was aligned on one common goal: proving that DOCSIS 4.0 technology is not simply a theoretical leap forward but that it is a commercially viable technology ready for wide-scale rollout. The interoperability tests weren’t simply about passing; they were about performance headroom, feature robustness and forward-compatibility.
And the results? Let’s just say fast doesn’t even begin to describe it.
The Showstopper: 16 Gbps Downstream
If there was a single number everyone walked away talking about, it was 16 Gbps downstream. Achieving this kind of throughput in a lab environment is one thing; demonstrating it live in a collaborative interop environment — across multiple suppliers — is something else entirely.
This wasn’t an isolated “best case” setup either. Several configurations reached double-digit gigabit speeds, showing that DOCSIS 4.0 technology isn’t just an incremental step — it’s a foundation for multigigabit service tiers that can compete head-to-head with fiber.
Collaboration Is the New Competition
Perhaps the most inspiring part of the event wasn’t the hardware or the speed tests — it was the culture of collaboration. Ten different modem suppliers, each with their own market goals, came together to ensure that when DOCSIS 4.0 technology hits the field, it will work seamlessly across the ecosystem. The modems spent most of the interop working on the three cores, driving interoperability across the wider ecosystem with the RPD suppliers.
This spirit of cooperation ensures that innovation isn’t locked in silos. When suppliers solve interoperability challenges together, operators and consumers benefit from a smoother, faster rollout of next-gen services.
Additional Cable Modem PNM Operations
With a record number of modems in attendance, we rolled out the proactive network maintenance (PNM) tests for the modems. More and more, the signals on the plant are orthogonal frequency division multiplexing (OFDM) and orthogonal frequency division multiple access (OFDMA), which provide higher speeds and capacities than traditional quadrature amplitude modulation (QAM) signals.
At this interop, we ran five PNM tests on the modems, specifically getting data from DOCSIS 4.0 modems and verifying interoperability with the application programming interfaces (APIs) and with the data generated by the modems. This PNM data will enable the most efficient operation of the coaxial cable network, keeping the data levels at their peak by using the more efficient OFDM and OFDMA signals.
DOCSIS 3.1 Plus: Beyond the Buzzword
DOCSIS 3.1 Plus (DOCSIS 3.1+) was also prominent at the interop with several modems in attendance. The leap from DOCSIS 3.1 to DOCSIS 3.1+ is about raw speed. The “Plus” brings expanded support for more OFDM channels, which means more downstream speed. More than slides in a presentation, these advancements were tested, measured and verified in real time.
Operators are already discussing how these capabilities could fit into their network evolution plans. With the cost efficiency of leveraging existing HFC plant and the performance benefits on display, DOCSIS 3.1+ has emerged as a compelling strategy for rapid, wide-scale multigigabit deployment.
What’s Next
With the success of this record-breaking interop, the stage is set for even more ambitious goals. The industry now has proof that multi-vendor DOCSIS 4.0 systems can deliver and play nicely together. The next steps will likely include refining firmware for even better efficiency and starting the migration path toward DOCSIS 4.0 technology.
There are lots of moving parts in these interops, but one thing is certain: the 16 Gbps milestone will be remembered not just for the number but for what it represents — the moment when the industry saw the future of HFC networks and realized it was already within reach.
This interop wasn’t just an event — it was a benchmark for the broadband industry’s future. With record attendance, diverse vendor participation and real-world proof of DOCSIS 4.0 capabilities, the path to multigigabit broadband has never been clearer.
Another DOCSIS 4.0 interop is planned for the week of Oct. 20 at CableLabs. Consider joining us to see the speed and service possibilities firsthand!
Learn More at SCTE TechExpo
There’s still time to join us at SCTE TechExpo25, Sept. 29–Oct. 1, 2025, in Washington, D.C. Employees of CableLabs member companies are eligible to receive a complimentary full-access pass. Register today if you haven’t yet!
If you’re attending, plan to attend “Self-Healing Networks: The New Frontier of DOCSIS Operations” on Monday, Sept. 29. In this session, my CableLabs colleagues will join a conversation on how PNM and Profile Management Application (PMA) technologies can create intelligent, self-optimizing networks that proactively detect issues, adapt performance in real-time and shift operations from reactive troubleshooting to automated network resilience.
DOCSIS
Speed, Scale and Seamless Integration: Key Industry Firsts at DOCSIS 4.0 Interop

Key Points
- With CableLabs’ latest Interop·Labs event, DOCSIS® 4.0 interoperability has reached a new level of maturity as multiple vendors successfully demonstrated high-performance operation across modem components.
- A convergence of industry firsts during the event signaled a real-world readiness for DOCSIS 4.0 deployment, proving that the technology is ready to deliver the performance, flexibility and vendor diversity we've been working toward.
The broadband industry is experiencing a transformative moment — one defined by unprecedented collaboration, groundbreaking technology and milestone achievements that set the tone for the future of connectivity. Today, we’re excited to highlight a convergence of firsts that represent significant strides in driving scalable, interoperable and high-performance broadband networks.
These advances were on full display at the latest Interop·Labs event, held June 9–12 at CableLabs’ headquarters in Louisville, Colorado. The event provided an opportunity for suppliers to verify interoperability between equipment designed to be compliant to the DOCSIS 4.0 specifications. The focus: speed and stability, two critical factors that directly impact the quality and reliability of broadband service.
A New Milestone: Uniting Innovation With Scale
In this blog post, we’ll walk through the key breakthroughs that made this interop a milestone event for DOCSIS 4.0 technology and the broadband industry as a whole.
1. 10 DOCSIS 4.0 Modem Suppliers
Interest in delivering modems into the DOCSIS technology ecosystem remains high, with 10 modem suppliers having attended a DOCSIS 4.0 interoperability event at CableLabs.
2. Three CCAP Core Suppliers Demonstrating Advanced Capabilities
In an industry first, three DOCSIS core suppliers attended the interop and demonstrated:
- Stable registration with multiple high-speed channels.
- Cable modem interoperability.
- High-speed throughput both upstream and downstream.
- Advanced service features.
The successful interop of multiple cores with the modems at the interop further proves that operators are no longer bound to a single core vendor solution. Instead, they can architect their networks based on performance, cost and feature alignment — without compromising on integration or scale.
3. Five RPD Suppliers Interoperating in a Single Network
Additionally, for the first time, five Remote PHY devices (RPD) were tested during the event and successfully achieved interoperability with the cores, reinforcing the maturity of the Distributed Access Architecture (DAA) ecosystem. Additionally, for the first time, five Remote PHY Devices (RPD) were tested during the event and successfully achieved interoperability with the cores reinforcing the maturity of the Distributed Access Architecture (DAA) ecosystem. This marks a major achievement for interoperability in a traditionally siloed space, where vendor lock-in could limit agility and innovation.
Each RPD supplier brought unique implementation characteristics to the table — ranging from management capabilities to different form-factors. The cores not only handled these diverse devices gracefully but also maintained service performance and control plane consistency while achieving high-speed data delivery.
4. Achieving 14 Gbps DOCSIS Downstream Throughput
The fourth major milestone is a technological leap forward: 14 Gbps of downstream DOCSIS throughput achieved across a multi-vendor network. This achievement leverages the full potential of DOCSIS 4.0 technology, DAA architectures, next-gen modulation (4096-QAM) and intelligent spectrum management.
This bandwidth benchmark isn't just a speed milestone — it’s a validation of the DOCSIS roadmap, demonstrating that hybrid fiber coax (HFC) infrastructure remains a future-ready platform that can compete with fiber on both performance and longevity.
Why These Firsts Matter
These achievements go beyond engineering milestones — they signal a new era of openness and agility in broadband infrastructure. For operators, this means:
- Faster innovation cycles due to supplier interoperability and innovation.
- Reduced operational risk via interoperable fallback options.
- Future-proof investments in scalable architectures like DAA and DOCSIS 4.0 technology.
For consumers and businesses, it translates to more reliable service, higher speeds and faster deployments of next-generation broadband.
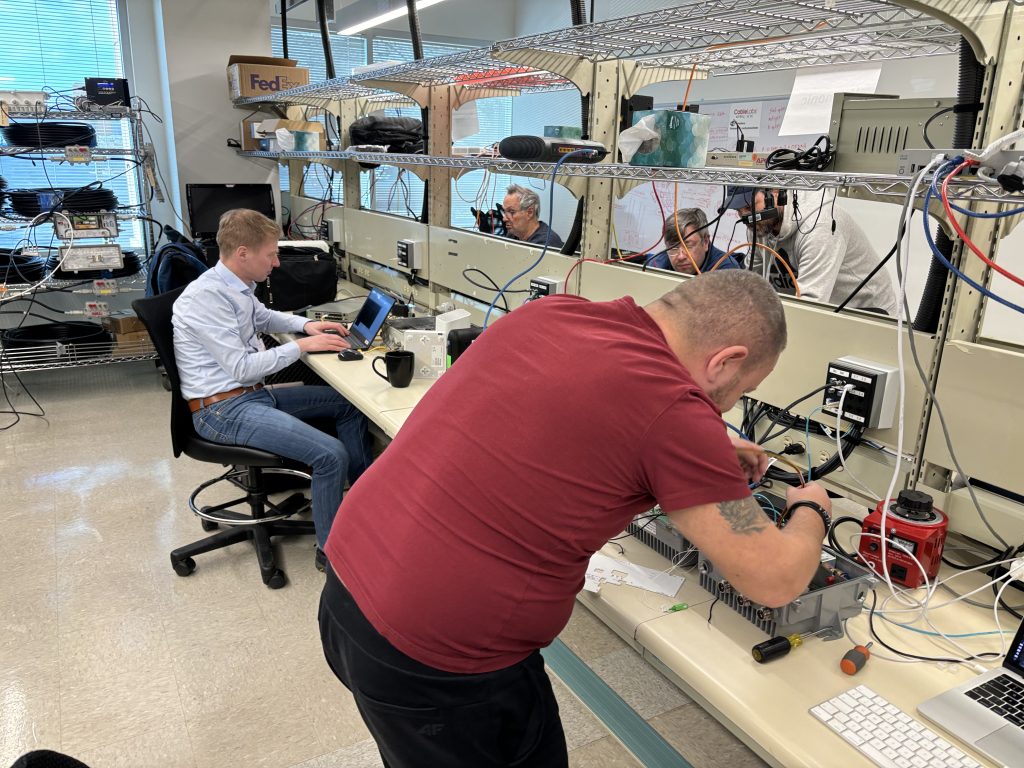
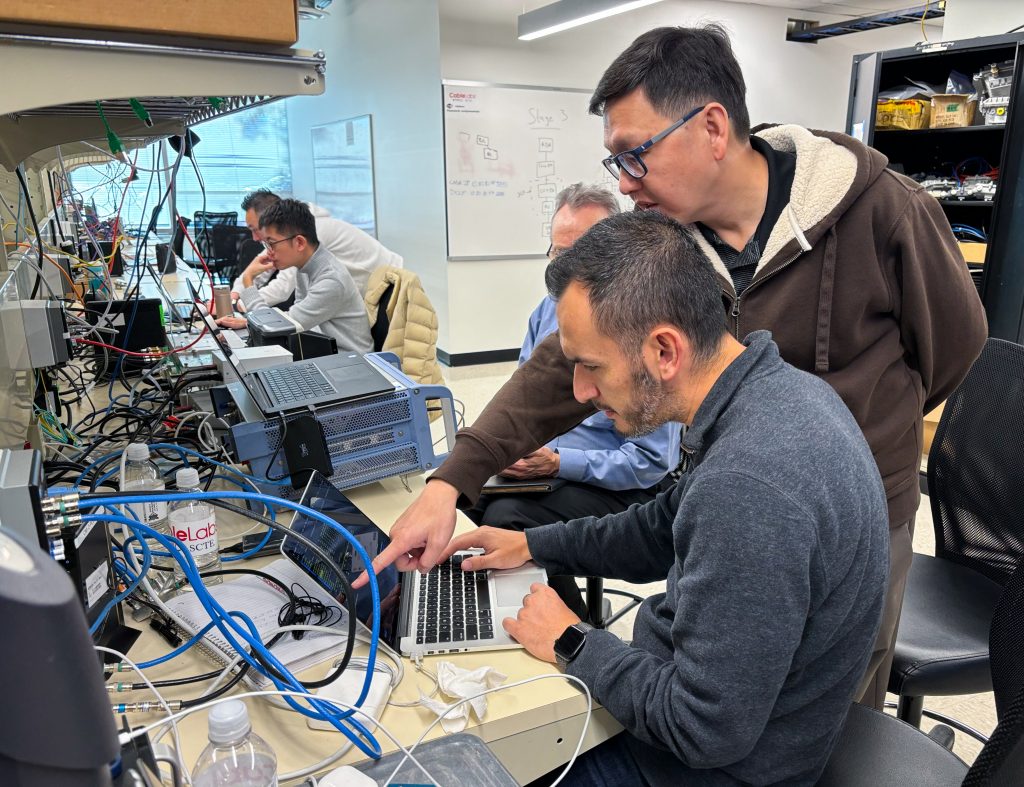
Participants test their equipment for interoperability, with a focus on speed and stability, during the June 2025 event at CableLabs.
Key Contributors and Participants
Attendance at the event was strong, with new suppliers, new products and three operators on hand to observe demos and share their DOCSIS 4.0 network progress.
Suppliers included CommScope, Harmonic and Vecima, who brought DOCSIS 4.0 cores to the event. For the first time, we saw five Remote PHY Device (RPD) platforms from: Calian, CommScope, Harmonic, Teleste and Vecima. Eight DOCSIS 4.0 modem suppliers in attendance — Arcadyan, Askey, Compal, Gemtek, Hitron, Sagemcom, Sercomm and Ubee — brought multiple cable modem models.
Participating in the event were chipmakers Broadcom and MaxLinear, who brought local engineering support for their cable modem partners. Calian participated with its test solutions, and Microchip brought its clock and timing system.
Testing combined virtual cores, RPDs and modems from different vendors to verify performance and cross-compatibility. DOCSIS 3.1 and 4.0 devices were once again integrated to showcase interoperability between legacy and next-gen technology. Suppliers providing test equipment used these setups to verify their solutions.
Looking Ahead
This confluence of industry firsts is not an endpoint, but a foundation. With successful demonstrations of interoperability, performance and scalability, our industry is entering a period where the promise of next-gen broadband becomes reality — not just in labs, but in communities around the world.
The future is open, fast and here — and we couldn’t be more excited to play a part in building it.
Upcoming Events
The next phase of broadband promises faster speeds, greater reliability and seamless integration across today’s HFC networks. Another DOCSIS 4.0 interop is planned in August at CableLabs. Consider joining us to explore the possibilities firsthand.
Also, registration is now open for SCTE TechExpo25, happening Sept. 29–Oct. 1, 2025, in Washington, D.C. The theme of the industry-leading annual event is “Network (R)Evolution: Delivering the Seamless Experience.” Join us to explore how operators can thrive amidst the transformation across wireline, wireless and converged networks. CableLabs members are eligible to receive a complimentary full-access pass to SCTE TechExpo.
DOCSIS
Interop Puts DOCSIS 4.0 Technology’s Speed and Stability Front and Center

Key Points
- The first DOCSIS® 4.0 Interop·Labs event of 2025 focused on speed and stability, providing another opportunity to test interoperability scenarios between products leveraging DOCSIS 4.0 technology.
- If you are attending CableLabs Winter Conference, join us for “The What, Why and How of Future HFC Solutions” to explore the potential of future generations of DOCSIS networks.
As the world of broadband connectivity evolves, so does the technology that powers it. The evolution of DOCSIS technology has been a cornerstone of high-speed internet delivery, enabling service providers to meet the growing demands for faster and more reliable internet access. DOCSIS 4.0 technology represents the latest milestone in this journey, offering impressive speeds and new capabilities.
The latest Interop·Labs event, which took place Feb. 10–13 at CableLabs in Louisville, Colorado, showcased these capabilities and more, focusing on speed and stability — crucial factors in determining the quality and reliability of an internet connection.
A Bright Future for DOCSIS 4.0 Technology
DOCSIS 4.0 technology is poised to revolutionize broadband connectivity, offering significantly faster speeds, better efficiency and enhanced security. Its backward compatibility with existing DOCSIS 3.0/3.1 infrastructure makes it a flexible solution for both service providers and consumers.
As with any major technological leap, ensuring smooth interoperability between old and new systems is key to a successful transition. By offering a scalable, future-proof solution that can be deployed gradually, DOCSIS 4.0 technology allows operators to gracefully migrate to these new products.
Why Speed and Stability Are Critical
Speed refers to how quickly data is downloaded or uploaded, often measured in megabits per second (Mbps), and plays a key role in activities such as streaming, gaming and video conferencing. Stability, on the other hand, is about the consistency of that connection.
A stable connection ensures that users experience minimal interruptions or slowdowns, even during peak usage times. Both high speed and stable performance are essential for seamless online experiences, especially in households or businesses that rely on multiple devices or heavy internet usage.
Key Contributors and Participants
The DOCSIS 4.0 specifications describe both frequency division duplex (FDD) and full duplex (FDX) modes of operation. For this interop, the first of 2025, new modems and RPDs that supported both modes (on the same device) were participants for the first time.
Attendance at the interop was high and included new suppliers and products, as well as two operators that joined to observe demonstrations, interact with the suppliers and discuss their own DOCSIS 4.0 network progress.
Suppliers included CommScope and Harmonic, who brought DOCSIS 4.0 CCAP cores to the event. For the first time, we saw new Remote PHY Device (RPD) platforms from three separate suppliers: Harmonic, Teleste and Vecima. Seven DOCSIS 4.0 modem suppliers — Arcadyan, Askey, Gemtek, Hitron, Sagemcom, Sercomm and Ubee — brought multiple cable modem models. Calian participated with its test solutions, and Microchip participated with its clock and timing system.
Broadcom has developed new chipsets that enable a device to operate in either FDD or FDX mode, under the control of the network. Another chipset supplier, MaxLinear, was also in attendance, exhibiting its latest DOCSIS 4.0 modem innovations.
Testing scenarios involved using a virtual core from one supplier, and RPDs and DOCSIS 4.0 cable modems from various other suppliers. The products were mixed and matched to verify interoperability scenarios and speeds through the system. As before, DOCSIS 3.1 and DOCSIS 4.0 devices were combined to demonstrate the cross-compatibility of existing and new technology. Suppliers providing test equipment used these setups to verify their solutions.
Broadband Service Enhancement
The February interop was another opportunity to drive interoperability between some of these new products/platforms and some existing ones, ensuring that the different systems and devices would seamlessly work together to exchange information. Interoperability is vital to enabling these devices to connect and interact. By fostering interoperability, the DOCSIS ecosystem continues to provide innovation and solutions to enhance broadband services, ultimately leading to better outcomes for consumers.
Remote PHY Interoperability
Although modems were the focus, the event also looked at the interoperability between DOCSIS 4.0 cores and RPDs. We branched into more and different configurations, moving beyond one-size-fits-all configurations. These products are going to be deployed in many scenarios, and going deeper into these various configurations will ensure flexibility as DOCSIS 4.0 technology moves into the field.
Join Us Soon
The next DOCSIS 4.0 interop is planned for the week of March 31 at CableLabs.
If you are a member or vendor attending CableLabs Winter Conference, join us for our two-part session “The What, Why and How of Future HFC Solutions.” We’ll explore the potential of future generations of DOCSIS networks, exploring how the evolution of the technology will support tomorrow’s hybrid fiber coax networks. This two-part session begins at 12:45 Tuesday, March 11.
With DOCSIS 4.0 technology, the future of broadband looks brighter, faster and more connected than ever before. The technology’s seamless integration into current systems ensures that consumers will continue to benefit from fast, reliable internet — no matter where they are on their broadband journey.
DOCSIS
DOCSIS 4.0 Interop Delivers on the 10G Playbook

Key Points
- The primary takeaways from the latest DOCSIS®️ 4.0 event involved performance, interoperability, energy efficiency and reliability.
- Detailed interoperability discussions focused on the virtualized CMTS core, remote PHY devices (RPDs) and modems in various real-world configurations, exploring how everything unambiguously works together.
- Energy-management features showed that it’s not just about speed but also about how the right technology can enhance customer experience.
At the latest DOCSIS 4.0 Interop·Labs event — which took place Nov. 4–7 at CableLabs’ headquarters in Louisville, Colorado — equipment suppliers showcased their efforts to deliver on the 10G platform through DOCSIS 4.0 technology. All four 10G pillars were on display: faster speeds, lower latency, enhanced security and increased reliability. These pillars were all designed into the DOCSIS 4.0 specifications, and we’ve reached the point at which the products simply work.
We want to thank the participants who helped make the event successful and once again helped us achieve a high level of productivity. To recap the major themes of the event:
- Speeds are rock solid. Demonstrations boasted downstream speeds faster than 9 Gbps that were limited only by the single 10 Gbps interface on the modems. Upstream speeds can exceed 2 Gbps on and go even higher.
- The new focus is interoperability. Products are maturing, and suppliers are differentiating their offerings. As operators continue to seriously develop deployment scenarios, we want to ensure that the specifications are clear enough to handle real-world deployment, including specific configurations, corner cases and race conditions. Four operators attended this interop to provide guidance on deployment scenarios. Much effort went into exercising interoperability and identifying areas for work.
- Energy efficiency is on the rise. A burgeoning trend at this interop was energy management. New features will benefit consumers by providing options to conserve energy in various scenarios.
- Reliability is a reliable theme. We continue to examine the copious data available from the modems — in particular, DOCSIS 4.0 cable modem Proactive Network Maintenance (PNM) functions that can be used to increase the reliability of service offerings.
Supplier Participation
Attendance at the interop was high, as it offered the last best opportunity to get this work in before the 2024 holiday season arrived. The aforementioned operators who joined us to observe demonstrations went out of their way to interact with suppliers and talk about their own DOCSIS 4.0 network progress.
Among the suppliers were CommScope and Harmonic, both of which brought DOCSIS 4.0 cores to the interop. There were also three 1.8 GHz remote PHY devices (RPDs) from CommScope, Harmonic and Vecima Networks. In addition, seven DOCSIS 4.0 modem suppliers — Arcadyan, Askey, Gemtek, Hitron, Sagemcom, Sercomm and Ubee Interactive — brought multiple cable modem models. Calian participated with its suite of DOCSIS technology analyzers and tools.
Remote-PHY Interoperability
The DOCSIS modem termination system (CMTS) has been virtualized, and the software portion is referred to as the core. The physical layer of the CMTS has moved to the RPD in the fiber node. In other words, the CMTS has been disaggregated, and the core and RPD can (and will) come from different suppliers. The modem can come from yet another supplier. These three pieces need to work together to provide service.
At our interop events, we like to delve into multiple real-world configurations. The core calls the shots and configures the RPD for the downstream and upstream signals, and then the core manages the DOCSIS cable modems. Flexibility is built into this scenario, however, and we’re constantly working to get everything right and interoperable. It’s for this reason that operators attend the interop events — to clarify how DOCSIS 4.0 technology can be introduced to the networks, including backward compatibility with existing services.
Energy Management
Energy management is an important function for cable modems. DOCSIS cable modems and cores support a low-power energy mode called the Energy Management (EM) mode. During idle times, when a single upstream and downstream channel can meet a user’s data-rate demand, the cable modem switches to EM mode. When the modem requires a higher data rate than the reduced set of channels can provide, the core instructs the modem to return to the larger transmit-and-receive channel set.
EM mode can also be used during a power outage — for example, when a modem goes into battery back-up but continues to provide digital phone service. In this scenario, EM mode can conserve battery power when the traffic is low, exhibiting minimum impact on normal service, to prolong access to digital voice service, especially the 911 emergency call service.
The EM feature shows how people rely on their broadband connection for all services, not just web and email. The feature also reveals how DOCSIS technology has evolved to address these needs as a broadband service of choice.
Proactive Network Maintenance
PNM is an important function that increases network reliability. We always look at the PNM data available from DOCSIS device, because it’s a sign of product maturity. This PNM data enables the most efficient operation of the coaxial cable network, keeping the data levels at their peak by using the more efficient orthogonal frequency-division multiplexing (OFDM) and OFDM access (OFDMA) signals, and allowing the diagnosis and maintenance of the network before consumers ever notice an issue.
Join Us Next Time!
We’ve gone beyond the basics of the four pillars. The focus of our DOCSIS 4.0 interops is now interoperability, interoperability and more interoperability! These products are soon headed to the field, in various configurations with multiple suppliers’ products having to work together. And this work will continue into 2025 as DOCSIS 4.0 technology comes into use.
The next DOCSIS 4.0 interop event is planned for the week of Feb. 10, 2025, at CableLabs’ headquarters in Louisville, Colorado. The event will provide an opportunity for new suppliers and new products as we kick off the new calendar year.
And don’t forget: Right around the corner in March 2025 are CableLabs Winter Conference and Smaller Market Conference.
DOCSIS
DOCSIS 4.0 Interop Dives Deeper Into Upstream Speed and SCTE TechExpo24 Prep

Key Points
- The latest DOCSIS® 4.0 Interop·Labs event took a deeper look at upstream speeds.
- The event provided suppliers an opportunity to sharpen their products — and pitches — for the upcoming SCTE®️ TechExpo conference in Atlanta.
At the latest DOCSIS 4.0 Interop·Labs event, a record number of modem suppliers were on hand to delve deep into upstream speed and other aspects of the DOCSIS 4.0 specifications. We want to thank the participants who helped make the event successful and once again helped us achieve a high level of productivity.
We cannot highlight enough how CableLabs provides a neutral testing ground for suppliers and operators to come together and showcase compatibility across interfaces defined in our DOCSIS 4.0 specifications. The gathering of suppliers and products in one location is extremely valuable to the participants to see how the technology is being implemented across multiple platforms. The DOCSIS 4.0 specifications are proscriptive, yet there’s plenty of room for innovation to differentiate products and offerings.
Combining interoperability events for these technologies drives home the fact that compatibility across all system components is a high priority for the industry.
To recap:
- Everything is coming up gigabits!
- Downstream speeds faster than 9 Gbps through a DOCSIS 4.0 modem are the new normal, limited only by the availability of a single 10 Gbps interface on the modems.
- Upstream speeds now exceed 2 Gbps on DOCSIS 4.0 modems and can go higher.
- We continue to examine the copious data available from the modems — in particular, DOCSIS 4.0 cable modem Proactive Network Maintenance (PNM) functions.
- DOCSIS 4.0 security technologies are coming along nicely, and their recent availability showcases the advancing maturity of the products.
DOCSIS 4.0 technology is putting down a marker. These products are delivering on the promise of multi-gigabit speeds that will benefit consumers around the world. Among suppliers and operators in our labs, we’re seeing unprecedented passion for interoperability, for unrivaled speeds and for getting these products to market.
Record Supplier Participation
Attendance at the interop was high, including new suppliers and products. Three operators joined us to observe demonstrations, interact with the suppliers and talk about their own DOCSIS 4.0 network progress.
Among the suppliers were CommScope and Harmonic, which brought DOCSIS 4.0 cores to the interop. For the first time, we saw three 1.8 GHz Remote PHY Devices (RPDs) from separate suppliers including CommScope, Harmonic and Vecima Networks. Also, for the first time, eight DOCSIS 4.0 modem suppliers — Arcadyan, Askey, Gemtek, Hitron Technologies, Sagemcom, Sercomm, Ubee Interactive and Vantiva — brought multiple cable modem models. Microchip Technology participated with its clock and timing system. The availability of record numbers of both DOCSIS 4.0 RPDs and DOCSIS 4.0 cable modems shows that products continue to proliferate as these suppliers prepare for SCTE TechExpo 2024 later this month.
Testing scenarios involved using a virtual core from one supplier, and RPDs and DOCSIS 4.0 cable modems from various other suppliers. The products were mixed and matched to verify interoperability scenarios and speeds through the system. As before, DOCSIS 3.1 and DOCSIS 4.0 devices were combined to demonstrate the cross-compatibility of existing and new technology. Suppliers providing test equipment used these setups to verify their solutions.
Sustained Speed
Achieving a rate of 9 Gbps (or faster) downstream through a DOCSIS 4.0 cable modem is now the new normal. Multigigabit speed is a core pillar of the 10G platform. At this interop, all modems achieved that downstream rate of speed — testament to the work achieved at previous interops.
At the August interop, we looked at upstream speed — that is, the stability of very high-speed traffic on upstream channels. Using a DOCSIS 4.0 ultra-high split, the modems in attendance consistently achieved more than 2 Gbps upstream. Upstream is trickier than the downstream: Whereas downstream is a continuous broadcast from one transmitter (the RPD), upstream is bursty, consisting of multiple modems contributing to the orthogonal frequency-division multiple access (OFDMA) signals that the RPD has to “catch” and accurately demodulate. That upstream burst receiver in the RPD is arguably the most complicated component of the system, especially considering the data rates in play.
So, we’ve arrived at a point where a DOCSIS 4.0 modem is pairing download speeds faster than 9 Gbps with upload speeds faster than 2 Gbps (and with the capability to go even faster). And we’re talking about a single modem. The service group can achieve even more capacity and speed, which means individual modems can also go higher.
Additional DOCSIS 4.0 Cable Modem Operations
Beyond speed, three other aspects of DOCSIS 4.0 technology stood out, offering a look at the maturity of the products at the interop.
PNM
PNM is an important function for cable modems. It’s a proven tool that engineers and technicians use for maintenance, troubleshooting and improvement of the cable plant. More and more, the signals on the plant are OFDM and OFDMA, which provide higher speeds and capacities than traditional quadrature amplitude modulation (QAM) signals.
At this event, we looked at five PNM tests that were run on all the modems. And because DOCSIS 4.0 modems generate more OFDM and OFDMA signals, more data is available. This is a sign of product maturity, responding to these data requests. And the modems have this down. This PNM data will enable the most efficient operation of the coaxial cable network, keeping the data levels at their peak by using the more efficient OFDM and OFDMA signals.
Security
Cable broadband is widely deployed. Hundreds of millions of consumers use DOCSIS technology every day as they live, work, learn and play. DOCSIS 4.0 technology includes strengthened measures to meet the threats that come with online activity. Suffice it to say, new security features are now appearing in products in the labs, and they’re being tested for both functionality and interoperability.
Remote PHY Interoperability
Although modems were the focus, the event also looked at the interoperability between DOCSIS 4.0 cores and RPDs. We branched into more and different configurations, moving beyond “one size fits all” configurations. These products are going to be deployed in many scenarios, and going deeper into these various configurations will ensure flexibility as DOCSIS 4.0 technology moves into the field.
Join Us Next Time
The next DOCSIS 4.0 interop is planned for the week of Nov. 4 at CableLabs’ headquarters in Louisville, Colorado. The event will provide an opportunity for both new suppliers and new products as we all prepare for the new calendar year.
Right around the corner in March 2025 are CableLabs Winter Conference and Smaller Market Conference.
DOCSIS
DOCSIS 4.0 Interop·Labs: A Year of Progress and Collaboration

Key Points
- The latest DOCSIS® 4.0 Interop·Labs event involved a deeper look at products to showcase the continuing maturity of the DOCSIS 4.0 ecosystem.
- The event examined speed in a new way, verifying long-term high speed through the system — capabilities that can lead to new products and services for consumers.
- Interop events began in July 2023 after the launch of the CableLabs DOCSIS 4.0 Cable Modem Certification program.
Achieving interoperability in the broadband industry is no small feat. It takes time, patience and attention to detail. Collaboration, problem-solving and flexibility. But, once achieved, interoperability powers innovation and competition within the ecosystem. It enables expanded market opportunities for equipment suppliers and offers operators more options for their subscriber services.
CableLabs provides a neutral testing ground for those suppliers and operators to come together and showcase compatibility across interfaces defined in our DOCSIS 4.0 specifications. Since the launch of the CableLabs DOCSIS 4.0 Cable Modem Certification program in June 2023, we’ve spent many action-packed weeks hosting DOCSIS 4.0 Interop·Labs events. And how far we’ve come in just a year! To recap briefly:
- We’ve achieved a downstream speed of over 9 Gbps through a DOCSIS 4.0 modem — a speed record.
- Testing scenarios have focused on combining DOCSIS 4.0 modems and Remote PHY equipment, as well as DOCSIS 3.1 and DOCSIS 4.0 equipment together, to demonstrate flexibility and backward compatibility.
- We’ve explored network reliability — in particular, DOCSIS 4.0 cable modem proactive network maintenance (PNM) functions in DOCSIS 4.0 cable modem termination systems — and DOCSIS 4.0 security technologies.
DOCSIS 4.0 and DAA Technologies
That momentum is continuing with the success of CableLabs and Kyrio’s most recent event, which combined DOCSIS 4.0 technology and Distributed Access Architecture (DAA). Combining interoperability events for these technologies drives home the importance of compatibility across all system components.
During the June 24–27 event, attendees pushed even deeper into testing the products to examine the intricacies of interoperability in a more nuanced way. Thank you to the participants who helped make the event successful — and once again — helped us unlock a new level of productivity.
The featured exercises involved DOCSIS 4.0 cable modems and DAA equipment. The DAA products included Remote MACPHY devices and Remote PHY equipment such as virtualized cores and Remote PHY Devices (RPDs) that support DOCSIS 4.0 technology. All of these systems came together during the week of exercises to demonstrate multi-supplier interoperability across the DOCSIS ecosystem.
Continued High Level of Participation
Attendance remained high with new suppliers and new products. Operators joined us to observe, interact with the suppliers and talk about their own DOCSIS 4.0 network progress.
Among the suppliers were Casa Systems, CommScope and Harmonic, which brought DOCSIS 4.0 cores to the interop. Remote PHY Devices (RPDs) from Casa Systems, CommScope, DCT-DELTA, Harmonic and Vecima Networks offered a mix of DOCSIS 3.1 and DOCSIS 4.0 technologies. DOCSIS 4.0 cable modems were provided by Arcadyan, Askey, Hitron Technologies, MaxLinear, Sagemcom, Sercomm and Ubee Interactive. Calian attended with its Remote PHY test system, which can be used to verify interoperability between DOCSIS 4.0 cable modems and a DOCSIS 4.0 core. Microchip Technology participated with its clock and timing system. Rohde & Schwarz brought its DOCSIS Signal Analyzer for continued development on DOCSIS 4.0 systems.
Testing scenarios involved using a virtual core from one supplier, and multiple RPDs and DOCSIS 4.0 cable modems from various suppliers. The products were mixed and matched to verify interoperability scenarios and speeds through the system. As before, DOCSIS 3.1 and DOCSIS 4.0 equipment were combined to demonstrate the cross-compatibility of existing and new technology. The test equipment suppliers used these setups to verify their solutions.
This interop had a different vibe than past events but proved that DOCSIS 4.0 modems continue to mature, which is enabling new investigations into the technology.
Sustained Speed
Achieving a rate of 9 Gbps (or more) downstream through a DOCSIS 4.0 cable modem is now the new normal. We’ve now achieved it on multiple modems and multiple cores. (And stay tuned. We’re now expecting DOCSIS 4.0 modems that can exceed speeds of 10 Gbps!)
In the July interop, we began looking at sustained speed — that is, the stability of very high-speed traffic over several hours. One test used two modems on a virtual core and RPD and ran 4 Gbps through each modem (8 Gbps through the core) for three hours, with no loss of data. That was over 5 terabytes (TB) of download per modem in 3 hours!
We also tried to find out how fast a system could download 1 TB. By putting 9.2 Gbps through a modem, we reached the 1 TB download in 18 minutes. That’s up to 50 hours of 4K movie content. More importantly, imagine what these speeds could mean for future services like home health care. This rate of high-speed data transfer will no doubt lead to transformative new products and services for the connected home.
Cable Modem PNM Operations
PNM is an important function for cable modems. These proven tools are used by engineers and technicians for maintenance, troubleshooting and improvement of the cable plant. More and more, the signals on the plant are orthogonal frequency division multiplexing (OFDM) and orthogonal frequency division multiple access (OFDMA), which provide higher speeds and capacities than traditional quadrature amplitude modulation (QAM) signals.
At this interop, we looked at five different PNM tests, specifically getting data from DOCSIS 4.0 cable modems and verifying interoperability with the application programming interfaces (APIs) and with the data generated by the modems. This PNM data will enable the most efficient operation of the coaxial cable network, keeping the data levels at their peak by using the more efficient OFDM and OFDMA signals.
Remote PHY Interoperability
While the modems were the focus, this event also included a deeper look at the interoperability between DOCSIS 4.0 cores and RPDs. These will be new infrastructure for operators and another interface around which interoperability must be proven. To facilitate best-in-class infrastructure for new DOCSIS 4.0 products and services, this interface has to demonstrate flexibility to allow configurations and channel plans that work best for an operator.
At the interop, we spent time purposely trying these new configurations. We sought to ensure the components asking for resources and assigning those resources can communicate and allow for flexibility in configuration that can be used in the new future as DOCSIS 4.0 technology moves into the field.
Join Us at SCTE TechExpo
The next DOCSIS 4.0 interop is planned for the week of Aug. 12 at CableLabs’ headquarters in Louisville, Colorado. The event will provide suppliers an opportunity to sharpen their products — and pitches — for the upcoming SCTE®️ TechExpo conference in Atlanta.
At TechExpo, the must-attend event for the broadband industry, CableLabs will highlight the products and efforts that occur at our Interop·Labs events. Full-access passes are free for CableLabs members. Register now to join us!
DOCSIS
A Busy DOCSIS 4.0 Interop Event Sets a New Downstream Speed Record

Key Points
- The latest DOCSIS® 4.0 Interop•Labs event involved new suppliers bringing new products, showcasing the depth and breadth of the DOCSIS ecosystem.
- Multi-vendor interoperability testing at the event allowed us to achieve a downstream speed of over 9 Gbps through a DOCSIS 4.0 modem — a new speed record.
- Interops keep getting busier, highlighting the continued importance of interoperability across the industry.
CableLabs and Kyrio hosted a combined DOCSIS 4.0 technology and Distributed Access Architecture (DAA) Interop•Labs event April 15–18 at our headquarters in Louisville, Colorado. Combining the interops for these technologies drives home the fact that interoperability across all the system components is a high priority for the industry.
And once again, the operators and suppliers in attendance made this event the most successful interop to date — and the busiest. We even achieved a downstream speed of over 9 Gbps through a DOCSIS 4.0 cable modem!
At this Interop•Labs event, the focus again was on interoperability. The featured exercises involved DOCSIS 4.0 cable modems and Remote PHY equipment, including virtualized cores and Remote PHY Devices (RPDs) that support DOCSIS 4.0 technology. During the week, the mixing and matching of systems and components demonstrated multi-supplier interoperability across the DOCSIS 4.0 ecosystem.
Record-Setting Number of Devices
The event included new suppliers who brought new products, showcasing the depth and breadth of the DOCSIS ecosystem. We set a record for the highest number of DOCSIS 4.0 cable modems and the most RPDs involved in a single interop! Operators also attended to observe demonstrations, interact with suppliers and talk about their own DOCSIS 4.0 technology plans.
As you can probably guess, it was the busiest interop yet. With all the equipment, suppliers and operators on site, it was standing room only in the interop lab — not a bad problem to have. The sheer number of attendees meant we had to move quickly through test scenarios.
Casa Systems, CommScope and Harmonic brought DOCSIS 4.0 cores to the interop, and Calian, Casa Systems, CommScope, DCT-DELTA, Harmonic and Vecima Networks brought RPDs that offered a mix of DOCSIS 3.1 and DOCSIS 4.0 technologies. Arcadyan, Askey, Hitron Technologies, MaxLinear, Sagemcom, Ubee Interactive and Vantiva showcased DOCSIS 4.0 cable modems. Rohde & Schwarz brought its DOCSIS 4.0 test and measurement system, and Microchip Technology participated with its clock and timing system.
Testing scenarios involved using a virtual core from one supplier, an RPD from another supplier and multiple DOCSIS 4.0 modems from various suppliers. The products were mixed and matched to verify interoperability scenarios and speeds through the system. As before, DOCSIS 3.1 and DOCSIS 4.0 equipment were mixed to demonstrate cross-compatibility of existing and new technology. The test equipment suppliers used these setups to verify their solutions.
An Interop•Labs event combined both DOCSIS 4.0 and Distributed Access Architecture technologies in interoperability testing scenarios.
9 Gbps Downstream Speed Unlocked
Multi-vendor interoperability testing is how we achieved a downstream speed of over 9 Gbps. This speed record shows several things: First, the products are nearing feature-complete status and are now being optimized for the speeds that DOCSIS 4.0 technology will bring to market.
Second, DOCSIS 4.0 technology will compete effectively with 10 gigabit passive optical network (PON) solutions that max out at about 8.5 Gbps downstream. DOCSIS 4.0 technology won’t only surpass that speed but will also provide more throughput to the neighborhood than what is possible with 10 gigabit PON. And lastly, these speeds are available over existing coaxial cable already serving tens of millions of customers around the globe.
It's About Network Cohesion
The number of suppliers and products in the industry continues to rise, and CableLabs’ Interop•Labs events bring all of the components of a DOCSIS 4.0 network solution together. With each interop, we’re successfully mixing and matching products from various suppliers and demonstrating interoperability across the interfaces defined in CableLabs’ specification.
In addition, together we’re achieving the multi-gigabit speeds and other advanced capabilities of DOCSIS 4.0 technology such as security, low latency and proactive network maintenance. Other parts of the DOCSIS 4.0 ecosystem are also becoming available, including hybrid fiber coax (HFC) network equipment such as amplifiers, taps and passives.
It’s exciting work, and we’re always looking forward to the new developments and takeaways that come out of events like these. Catch up on past interops and click the button below to stay up to date on future DOCSIS technology interop events.

DOCSIS
Combined DOCSIS 4.0 Interop Event Stresses Network Interoperability and Virtualization

Key Points
- The recent Interop•Labs event combined systems and components to demonstrate multi-supplier interoperability across the DOCSIS 4.0 ecosystem.
- Test scenarios included combining DOCSIS 3.1 and DOCSIS 4.0 equipment to demonstrate additional flexibility for operators.
- Interoperability is key to creating a healthier ecosystem because it enables more competition and operator scalability.
CableLabs and Kyrio hosted a combined DOCSIS® 4.0 technology and Distributed Access Architecture (DAA) Interop•Labs event February 12–15 at our headquarters in Louisville, Colorado. This was the first combined interop between CableLabs and its subsidiary, and the involved suppliers and operators made it a success.
At this Interop•Labs event, the exercises included both DOCSIS 4.0 cable modems and Remote PHY equipment, including virtualized cores and Remote PHY Devices (RPDs) that support DOCSIS 4.0 technology. During the week, mixing and matching of systems and components demonstrated multi-supplier interoperability across the DOCSIS 4.0 ecosystem.
Interop Takeaways
Casa Systems, CommScope and Harmonic brought DOCSIS 4.0 cores to the interop, and Casa Systems, Cisco, CommScope, DCT-DELTA, Harmonic, Teleste and Vecima brought RPDs that offered a mix of DOCSIS 3.1 and DOCSIS 4.0 technologies. Arcadyan, MaxLinear and Ubee Interactive showcased DOCSIS 4.0 modems. Rohde & Schwarz also participated with its DOCSIS 4.0 test and measurement system. Operators attended to observe the interop, interact with the suppliers and talk about their DOCSIS 4.0 technology plans.
The focus of the interop was interoperability across the ecosystem. A common test scenario at the event involved a virtual core from supplier A, an RPD from supplier B and a DOCSIS 4.0 modem from supplier C, all connected and operating according to specifications. The products were mixed and matched to investigate interoperability scenarios, with suppliers pitching in to analyze the results. To demonstrate extra flexibility for cable operators, suppliers mixed DOCSIS 3.1 and DOCSIS 4.0 equipment because the specifications are written for cross-compatibility.
Above, engineers collaborate during the first combined DOCSIS 4.0 Interop•Labs event hosted by CableLabs and its subsidiary, Kyrio.
Interestingly, the interop illustrated how the traditional cable modem termination system (CMTS) has been disrupted by virtualization. Provided by one supplier, the CMTS used to be one box that did it all. Now, the software components have been abstracted into a virtual core that runs on servers in our data center, while the physical-layer components have migrated to the fiber node. This virtual architecture provides both better scalability and improved flexibility for the software, as well as better physical-layer performance on the coaxial cable. And in between, the fiber-optic cable uses much more scalable digital Ethernet connections.
The interop also demonstrated that the core and fiber node components can come from different suppliers because that interface is described in the CableLabs Remote PHY specifications. Looking at interoperability from all angles benefits all stakeholders. Interoperability enables a larger market in which suppliers can compete, which leads to varying competitive strategies and healthier ecosystems. Interoperability gives operators the confidence to plan large installations and the certainty that the equipment they put in the field this year will work for years to come.
Remote PHY interoperability events began in 2017 with DOCSIS 3.1 technology, so these solutions have been in the field for years and have matured. This interop shows that the migration to DOCSIS 4.0 technology is both very far along and proceeding smoothly — and that the supplier community has embraced interoperability among system components.
It's About Network Cohesion
The integration and optimization of the DOCSIS 4.0 ecosystem is underway. The goal has moved beyond simply booting DOCSIS 4.0 modems. Rather, we’re putting together all the parts, mixing and matching from different suppliers, demonstrating interoperability across the interfaces defined in CableLabs specification and achieving the multi-gigabit speeds and other advanced capabilities of DOCSIS 4.0 technology such as security, low latency and proactive network maintenance.
Other parts of the DOCSIS 4.0 ecosystem are also becoming available, including hybrid fiber coax (HFC) network equipment such as amplifiers, taps and passives.
To learn more about this exciting evolution, join us next month at CableLabs Winter Conference. This exclusive event for CableLabs members and the NDA vendor community will explore DOCSIS technology in two powerful sessions: “Unleashing the Full Potential of the DOCSIS 4.0 Network” and “A Vendor Perspective on DOCSIS 4.0 Technology Implementation.” You’ll hear from industry leaders about effective strategies, opportunities and benefits of the DOCSIS 4.0 network. Join us!

DOCSIS
Focus Shifts to Network Reliability in DOCSIS 4.0 Interop·Labs Event

CableLabs and Kyrio hosted a DOCSIS® 4.0 Interop·Labs event November 6–9 at our headquarters in Louisville, Colorado. It was a busy, week-long experience that highlighted multiple facets of DOCSIS 4.0 technology, and the many suppliers involved worked together to make it a success.
The primary focus of the event was network reliability — in particular, DOCSIS 4.0 cable modem (CM) proactive network maintenance (PNM) functions in DOCSIS 4.0 cable modem termination systems (CMTSs). There also were Remote PHY Device (RPD) interoperability exercises.
At this interop, four DOCSIS 4.0 CMs from four suppliers were interconnected to both DOCSIS 4.0 and DOCSIS 3.1 CMTSs from three companies. Participating suppliers were Arcadyan, Casa Systems, DCT-DELTA, Harmonic, Sagemcom, Ubee Interactive, and Vecima Networks. Rohde & Schwarz also participated with its DOCSIS 4.0 test system. Operators attended to observe the interop and talk about their DOCSIS 4.0 technology plans.
Engineers collaborate in a DOCSIS 4.0 Interop·Labs event at CableLabs' headquarters in November.
Network Reliability at the Forefront
Every day, hundreds of millions of broadband consumers use DOCSIS technology, and they depend on a reliable connection. DOCSIS PNM, which uses data provided by DOCSIS equipment, is foundational to the reliability of that connection.
For operators to keep tabs on the network and their offered services, data elements need to be both available and accurate. The goal of PNM is to fix issues before customers even realize there is a problem — before any service impacts occur.
PNM technology can be summarized into three areas: data collection, algorithms that use the data to analyze the network, and network operations to ensure continuous service.
Data collection. DOCSIS equipment generates vast amounts of network performance data to detect and measure issues within the cable plant. What kind of data? Data about both downstream and upstream RF performance, data on the spectrum in use, data on the signals on the coaxial cable, data on how the transmitters and receivers are operating, and more. At the interop event, we verified that the data reporting is both there and correctly formatted. For operator systems to use that data effectively, it has to be standardized in order for every modem from every manufacturer to report apples-to-apples information so that operator systems can use that data effectively.
Analysis algorithms. Once data is collected from the CMs, it’s run through algorithms to examine the health of the network. Systems sift through this data constantly, looking for anomalies. At the interop, the algorithms were discussed and compared, with operators describing how the data is used and what is being looked for.
Network operations. The DOCSIS PNM team maintains a reference document that describes how the data must be formatted, how it can be collected and which algorithms can be run on the data. Numerous SCTE Cable-Tec Expo papers discuss how to interpret the data and use it to maintain the network at the highest levels of service. The interop event featured eight high-runner PNM tests, collecting data from the DOCSIS equipment and putting it through algorithms. In the lab, it’s possible to simulate errored network conditions and use the data and algorithms to verify the condition of the network. SCTE is also involved with preparations for DOCSIS 4.0 tools and deployments, as Jason Rupe describes in the blog post “Ready, Set, 4.0: Tooling Up for DOCSIS Technology’s Rollout.”
A Comprehensive DOCSIS 4.0 Interop Event
Attending the event was one participant’s DOCSIS 4.0 virtual core platform and fiber node, which included a DOCSIS 4.0 extended spectrum DOCSIS (ESD) remote PHY device (RPD). This solution was a DOCSIS 4.0 ESD CMTS, and the DOCSIS 4.0 CM suppliers were excited to work with it. The DOCSIS 4.0 ESD CMTS operated both on a DOCSIS 4.0 ultra-high-split as well as up to 1.8 GHz on the coaxial cable. Both speed testing and security testing were examined against the DOCSIS 4.0 CMTS, continuing the work from previous interop events.
Remote-PHY Interop Exercises
DOCSIS 4.0 technology requires a distributed access architecture (DAA). At this interop, suppliers exhibited an array of DOCSIS 4.0 virtual cores. One supplier, which manufactures fiber nodes and RPDs, brought its DOCSIS 3.1 RPD with enhanced DOCSIS 3.1 capabilities. CableLabs and Kyrio were ready to support this kind of interop too. In essence, then, this wasn’t merely a DOCSIS 4.0 interop, but also a Remote PHY interop!
Collaborative DOCSIS Technology Evolution
At the DOCSIS 4.0 Interop·Labs event, CMTS and CM suppliers continued their efforts to verify that their equipment works together, further peeling the onion and diving into the nitty-gritty details of the specifications. This is where interoperability really happens.
All of the participants, along with us at CableLabs, left with a stronger understanding of product functionality and multi-vendor interoperability — and new work to do. Moving forward, the suppliers will continue to collaborate to refine their products and add further functionality.
Interop events are a major step toward large-scale deployment of DOCSIS 4.0 technology. Another step is certification. To find out more about Cable Modem Certification, click the button below.