All cable operators would like to find and fix problems quickly, hopefully before a customer experiences a problem.
Long ago, before the advent of DOCSIS, the cable plant was one-way downstream and operators waited for the customer to inform them that something was not working as intended, usually with a phone call. With DOCSIS and the advent of two-way communication, the reporting process became potentially easier, but without an operational support system, the fallback was still the telephone. The Cable Modem Termination System (CMTS) could, for example, know that a particular Cable Modem (CM) had dropped off-line, but without any software to discover the problem and report the event to an attentive OSS, the subscriber still had to pick up the phone and talk to a human. This situation became much less acceptable when the cable system also became the phone system, as well as an interactive video entertainment system.
Traditionally there have been about 8 base indicators for problems in a cable network. These include details such as excessive transmit power at the CM or low receive CM signal levels. There were also indicators for high packet or codeword errors, both at the CM and CMTS, and low receiver MER (modulation error rate, a measure of noise and interference in the signal). While these indicators are useful, they are deficient at telling an operator exactly what a problem is. For example, should a line technician or an installer be sent? Where should they go and what should they be told to check? In any case, high packet errors generally indicate a poor customer experience, if anyone is using the affected frequencies while the packet errors are occurring.
Hooks for cable operational support systems (OSS), which have traditionally used IPDR (Internet Protocol Detail Records) or SNMP (Simple Network Management Protocol) to relay DOCSIS MIBs (management information base) data, have been steadily improving, and are on a threshold of quantum improvements. In the early days, some of the MIBs were not sufficiently well specified or implemented to produce valuable data. That is rapidly changing.
The first MIB objects to be exploited for detailed intelligence about plant issues were upstream equalization coefficients. DOCSIS uses upstream linear pre-distortion at the CM so that a burst transmission, after it passes through network distortion, arrives at the CMTS clean. An analogy would be eyeglasses that pre-distort an image so that it arrives on your retina in-focus.
As an example, wiggles in the frequency response indicate standing waves generated by an echo tunnel. One or both ends of a severe echo tunnel locate a signal reflection caused by a damaged cable plant. The frequency of the standing waves can be measured to reveal the length of the echo tunnel, which indicates a line distance.
Further enhancements to the pre-distortion analysis technique allowed accurate grouping of common impairments affecting multiple CMs. If the network’s topology is known, a POI (point of interest) can be located on a map where the common impairment is likely located.
Another enhancement was the generation of a time-line for the small percentage of impairments that were intermittent. Figure 1 illustrates, with the top two plots, the upstream channel’s time and frequency graphs for a single CM from data taken over 3 days every 10 minutes respectively. The two colors of traces indicate that the connections were intermittent. The third trace indicates power variation with time and the fourth trace illustrates the variation in the upstream’s linear distortion. Generally while the connection was intermittent, more transmit power was required.
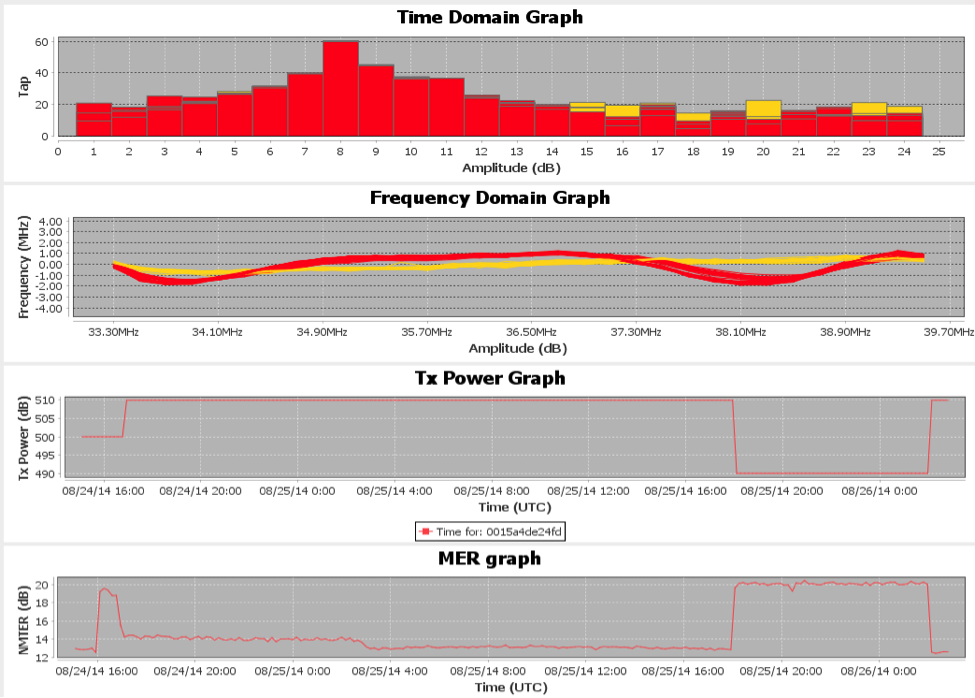
Figure 1 An intermittent CM observed over 3 days
A second valuable MIB object came from newer CM chips that could do full-band capture as part of their demodulation process. These chips allowed a full-band spectrum analyzer functionality to be provided by the CM. Figure 2 is a spectral plot from a CM.
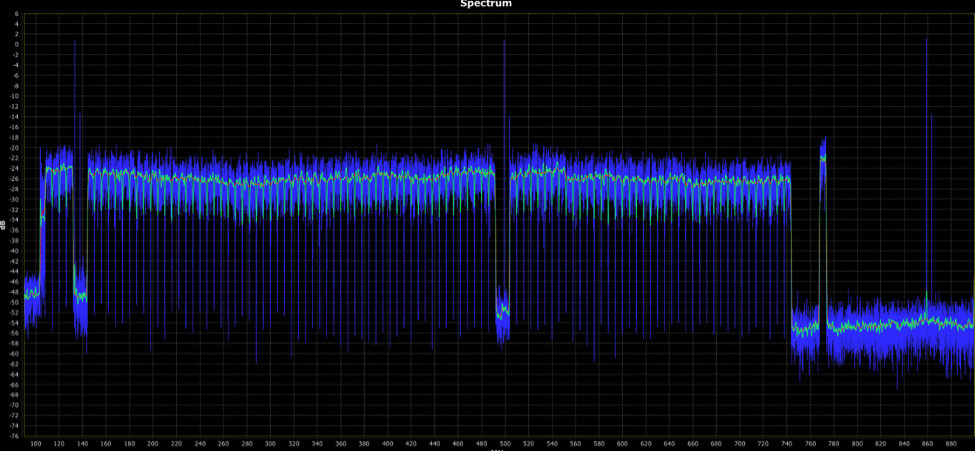
Figure 2 A full-band spectrum analyzer plot captured by a CM in the field.
Now, with some concerted and coordinated effort there is a potential for our diagnostic capabilities to take a big step forward with DOCSIS 3.1. Section 9 of the DOCSIS 3.1 PHY specification describes a powerful set of management objects that should allow more efficient plant maintenance. However, these benefits will not fall out of the sky. Careful coordination and collaboration will be required with the equipment vendors and cable operators to get the correct data sets into correct formats.
Other opportunities for big operational improvement also exist. For example, terminal devices can have an ability to generate their own complaints, even when the subscriber is not home. But terminal devices are only a component of a network.
Recognizing that the device closest to the subscriber likely knows the most about the subscriber’s experience, it is also possible to use the collective past experiences of several subscribers’ terminals to identify common problems affecting multiple subscribers, as well as problems affecting only one subscriber. This functionality could be stored in a common format log similar to a syslog.
In short, the future of cable OSS can be as bright as we are willing to make it – given lots of hard work, thanks to the management objects specified by DOCSIS 3.1.
Tom Williams is Principle Architect with the Network Technologies group at CableLabs. Tom’s main interest is in the physical layer of cable networks, and he enjoys digital signal processing (DSP), RF network design, and testing. He has been a cable engineer for 34 years.